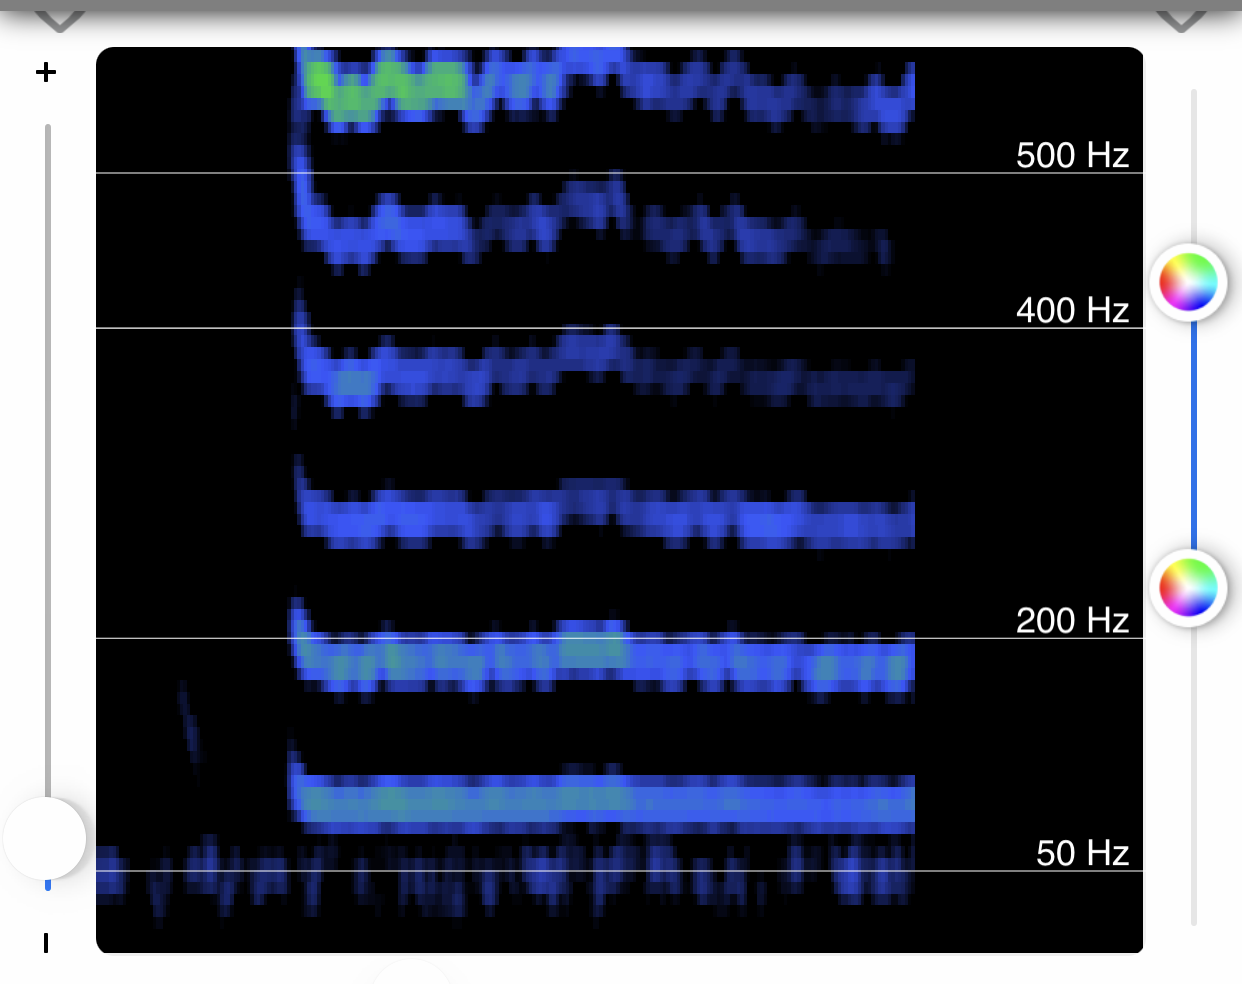
By default, the spectrogram appears on the Live View of the Thinklabs Wave app, as shown in the image to the left. A spectrogram is a picture of sound, displaying the frequencies that make up the sound, from low to high, and how they change over time, from left to right. If you prefer not to use the spectrogram and would like to hide it from view, follow the steps below.
STEP 1: Open the Thinklabs Wave app on your mobile device.
NOTE: For more information on recording sounds onto your mobile device using the Thinklabs Wave app, click here.

STEP 2: Click the hamburger menu.

STEP 3: Click Settings.

STEP 3: Deselect Show Spectrogram.

STEP 4: Click Save.

When the spectrogram is hidden, the Live View will appear as shown below.
